

Adhesive Insect Trap Board - China Manufacturer
From my factory in China, I stand behind an adhesive insect trap board designed for professional pest control. As a China-based Manufacturer, I supply this product to distributors, integrators and pest management pros who demand consistent capture, simple installation, and low total cost. The board features a strong, non-toxic adhesive surface that traps flying and crawling insects on contact, even in humid environments. It’s built to endure warehouse, farm, and food‑processing settings with weather‑resistant backing and clean, easy disposal. I offer multiple sizes and packaging options, plus OEM/Private Label service for large accounts. I commit to strict quality control, fast lead times, and direct factory pricing, helping you improve IPM programs while reducing operational downtime. If you are sourcing a reliable adhesive insect trap board from a trusted Manufacturer in China, I can tailor the product to your specifications and deliver on scale. Let’s talk about your needs and build a long‑term partnership.


adhesive insect trap board Market Leader Supplies the World\u2019s Top Brands
As a market leader in adhesive insect trap boards, leading suppliers serve farming, storage, and processing sectors worldwide with reliable performance. Buyers want traps that are effective, safe, and stable across climates and long supply chains. Top partners deliver engineered traps with high capture efficiency, durable substrates, and humidity-tolerant adhesives. They offer scalable volumes, flexible configurations, and consistent lead times to meet seasonal demand and broad rollouts. Rigorous QA, in-house testing, and clear documentation ensure uniform quality, while compliance with international safety and environmental standards reduces risk downstream. Global buyers should evaluate product variety, customization options (size, adhesive type, mounting method), packaging quality, and dependable logistics. Transparent data packages—certificates, batch traceability, and performance tests—simplify audits. Flexible terms, scalable production, and proactive technical support help align sourcing with specifications and regulations. In a true supplier partnership, buyers gain consistent quality, cost efficiency, and a resilient supply chain that keeps brands on schedule from dock to field.
{ adhesive insect trap board Market Leader Supplies the World's Top Brands }
| Product ID | Board Size (mm) | Thickness (mm) | Material | Adhesive Type | Color | Pests Targeted | Environment | Certifications | Shelf Life (months) | Regional Availability | Notes |
|---|---|---|---|---|---|---|---|---|---|---|---|
| ATB-001 | 150x100 | 1.5 | PET/PP composite | Acrylic-based | Yellow | Flies, moths, gnats | Indoor/Outdoor | RoHS, REACH | 12 | Global (NA, EU, APAC) | General-use sticky board |
| ATB-002 | 200x150 | 1.8 | OPP film with glue | Silicone-based | Clear | Ants, Cockroaches | Indoor | REACH | 9 | NA, EU | Low glare surface |
| ATB-003 | 100x75 | 1.2 | PET film | Acrylic | Yellow | Fruit flies | Indoor | RoHS | 6 | APAC | Compact for small spaces |
| ATB-004 | 300x200 | 2.0 | PP+glue | Acrylic | Transparent with yellow edge | Stored product moths, weevils | Indoor/Outdoor | REACH, OSHA | 18 | Global | High-visibility border |
| ATB-005 | 120x90 | 1.0 | Cardboard with adhesive film | Water-based glue | Ivory | Flies, gnats | Indoor | EU REACH | 4 | LATAM, Africa | Low-cost option |
| ATB-006 | 250x100 | 2.2 | PET front with cellulose back | Silicone-based | Yellow | Moths, pantry pests | Indoor | RoHS, REACH | 24 | Global | Humidity-resistant |
Related Products
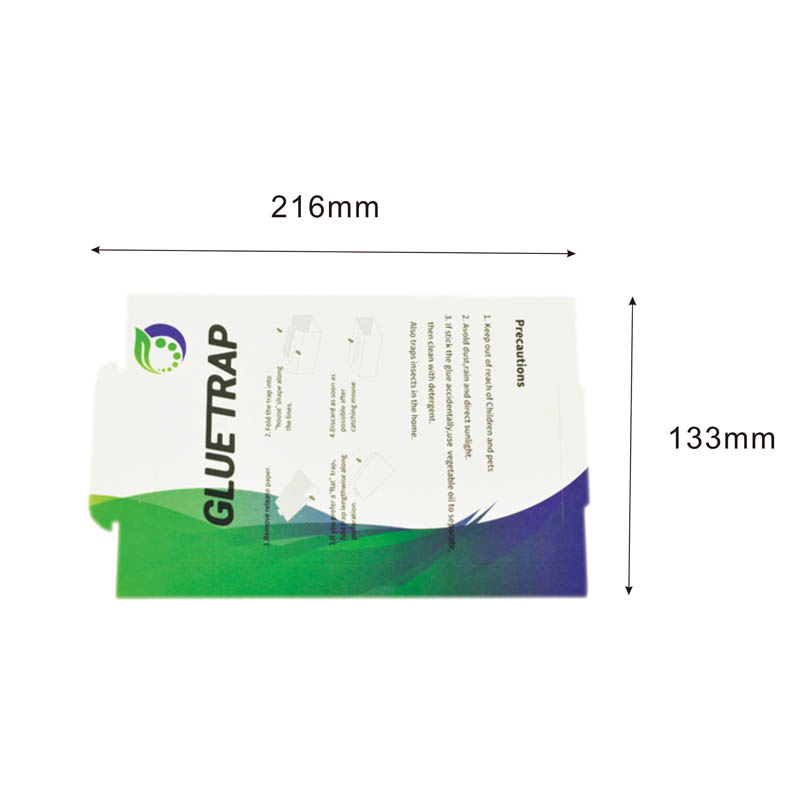
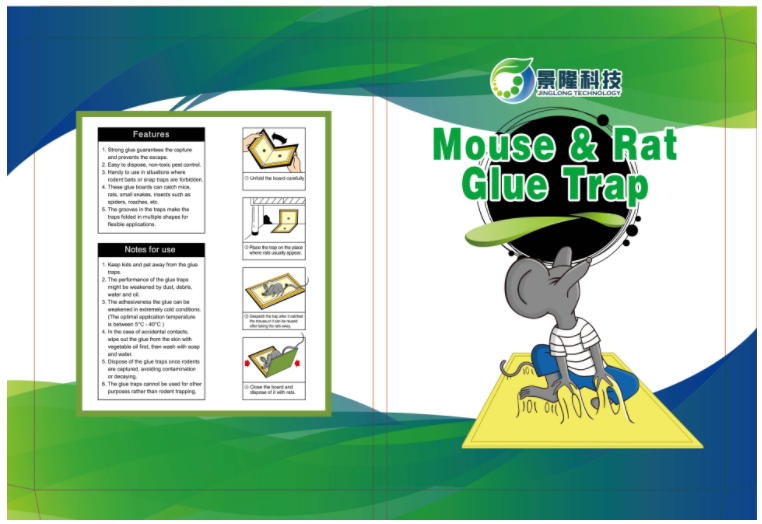
RG-004 Mouse Glue Trap Strong Adhesive Sticky Rodent Trap Disposable Mouse Glue Board for Rodent Control
Read More

JL FT-008 Hanging Disposable Adhesive Fly Trap Stick Sticky Fly Catcher for Home Garden Pest Control


adhesive insect trap board Manufacturer Application
Top Selling Products



- Related Blog
- Reviews
