

Fly Glue Trap Roll - China Manufacturer for Pest Control Solutions
From the moment I started in this business, I learn that a reliable Fly Glue Trap Roll is key for pest control in busy spaces. As a China manufacturer, we deliver consistent quality with our Fly Glue Trap Roll, designed for easy setup and strong stickiness that catches flies fast. Our rolls are non-toxic, odorless, and safe for food prep areas. I can offer different widths and lengths, come in sealed packaging, ready to deploy in warehouses, kitchens, hotels, and farms. Suppliers appreciate how simple it is to replace rolls, keep downtime to minimum, and monitor control with clean, mess-free disposal. We customize with your logo or private label if required; competitive pricing for bulk orders, fast lead times, and reliable shipping from China. If you want a proven solution to fly problems, our Fly Glue Trap Roll fits your demand as a manufacturer’s product. Contact me for samples or a quote today.
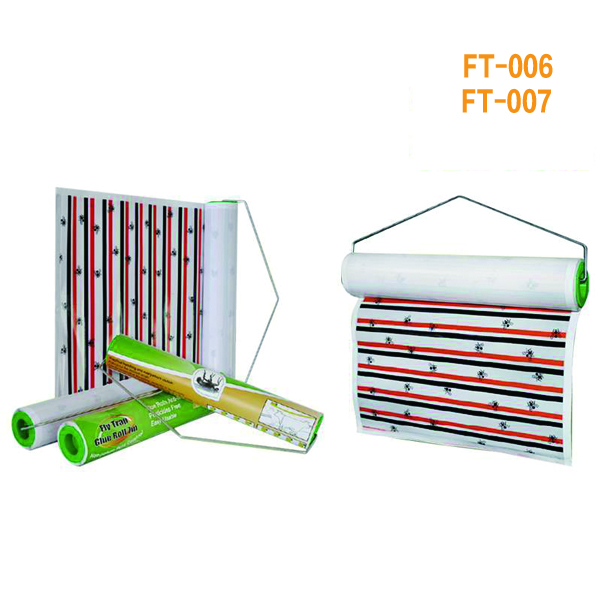
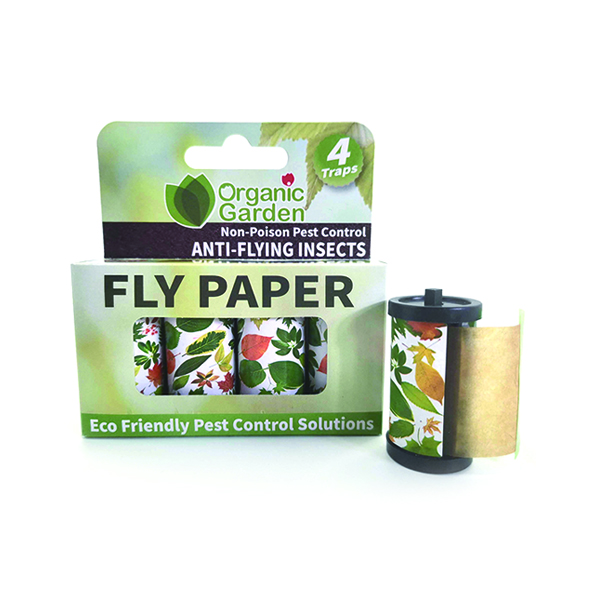


Fly Glue Trap Roll Application Now Trending
Global logistics hubs, hospitality, agriculture, and food processing are driving interest in fly glue trap roll applications for pest prevention. The roll offers continuous coverage, easy mounting in corners or on walls, and less waste than sheets. With low-odor, food-contact-safe adhesives, these rolls attract and trap flies quickly without strong vapors, making them suitable for transit facilities, warehouses, kitchens, and farms where cleanliness matters. Procurement buyers seek reliable supply, consistent tack, suitable roll widths, and packaging designed for high-volume use. Consider total cost of ownership, dispenser compatibility, storage conditions, and sustainability. As e-commerce and seasonal pest pressures rise, scalable roll programs with clear labeling help global buyers optimize sourcing, reduce handling, and maintain safety and regulatory compliance.
{ Fly Glue Trap Roll Application Now Trending }
| Year | Region | Season | Pests Targeted | Trap Width (mm) | Application Context | Estimated Annual Usage (thousand units) | Peak Month | Adoption Trend |
|---|---|---|---|---|---|---|---|---|
| 2022 | North America | Summer | Housefly; Fruit fly | 30 | Domestic & Food Service | 1,200 | August | Rising |
| 2022 | Europe | Summer | Housefly; Drain fly; Fruit fly | 45 | Food Processing | 1,000 | July | Rising |
| 2022 | Asia-Pacific | Summer | Housefly; Fruit fly | 50 | Agriculture & Domestic | 1,500 | June | Rising |
| 2023 | North America | Summer | Housefly; Fruit fly; Drain fly | 30 | Food Service | 1,900 | August | Rising |
| 2023 | Europe | Summer | Housefly; Fruit fly | 45 | Urban Retail | 1,400 | July | Stable |
| 2023 | Asia-Pacific | Summer | Housefly; Fruit fly | 50 | Agriculture | 2,000 | August | Rising |
| 2024 | North America | Summer | Housefly; Fruit fly | 50 | Domestic & Food Service | 2,100 | August | Rising |
| 2024 | Europe | Summer | Housefly; Fruit fly | 50 | Public Food Sector | 1,800 | July | Rising |
| 2024 | Latin America | Spring | Fruit fly | 45 | Agriculture & Domestic | 900 | May | Rising |
| 2025 | Asia-Pacific | Summer | Housefly; Fruit fly | 30 | Agriculture | 2,400 | August | Rising |
| 2025 | Africa | Summer | Housefly | 30 | Rural Homes | 1,100 | September | Stable |
| 2025 | Middle East | Spring | Fruit fly | 45 | Markets | 700 | May | Rising |
Related Products


Fly Glue Trap Roll For the Current Year Supplies the World\u2019s Top Brands
Top Selling Products



- Related Blog
- Reviews
