

Galvanized Steel Mouse Trap - China Manufacturer
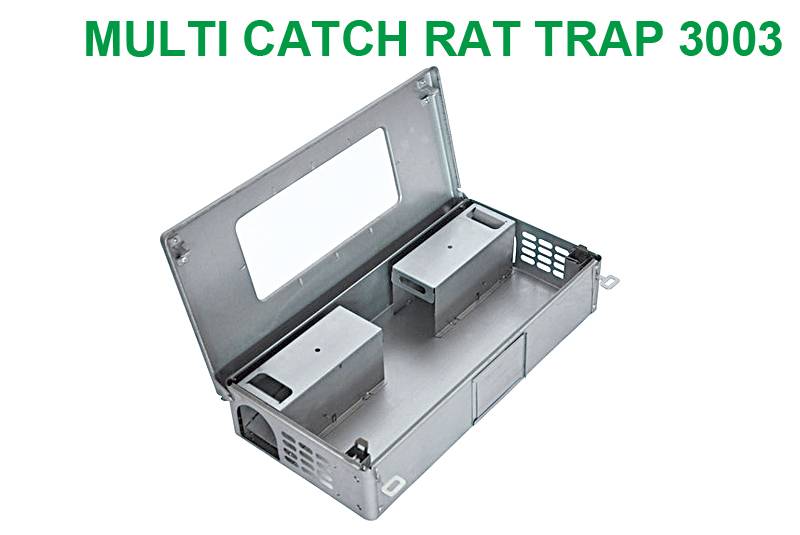
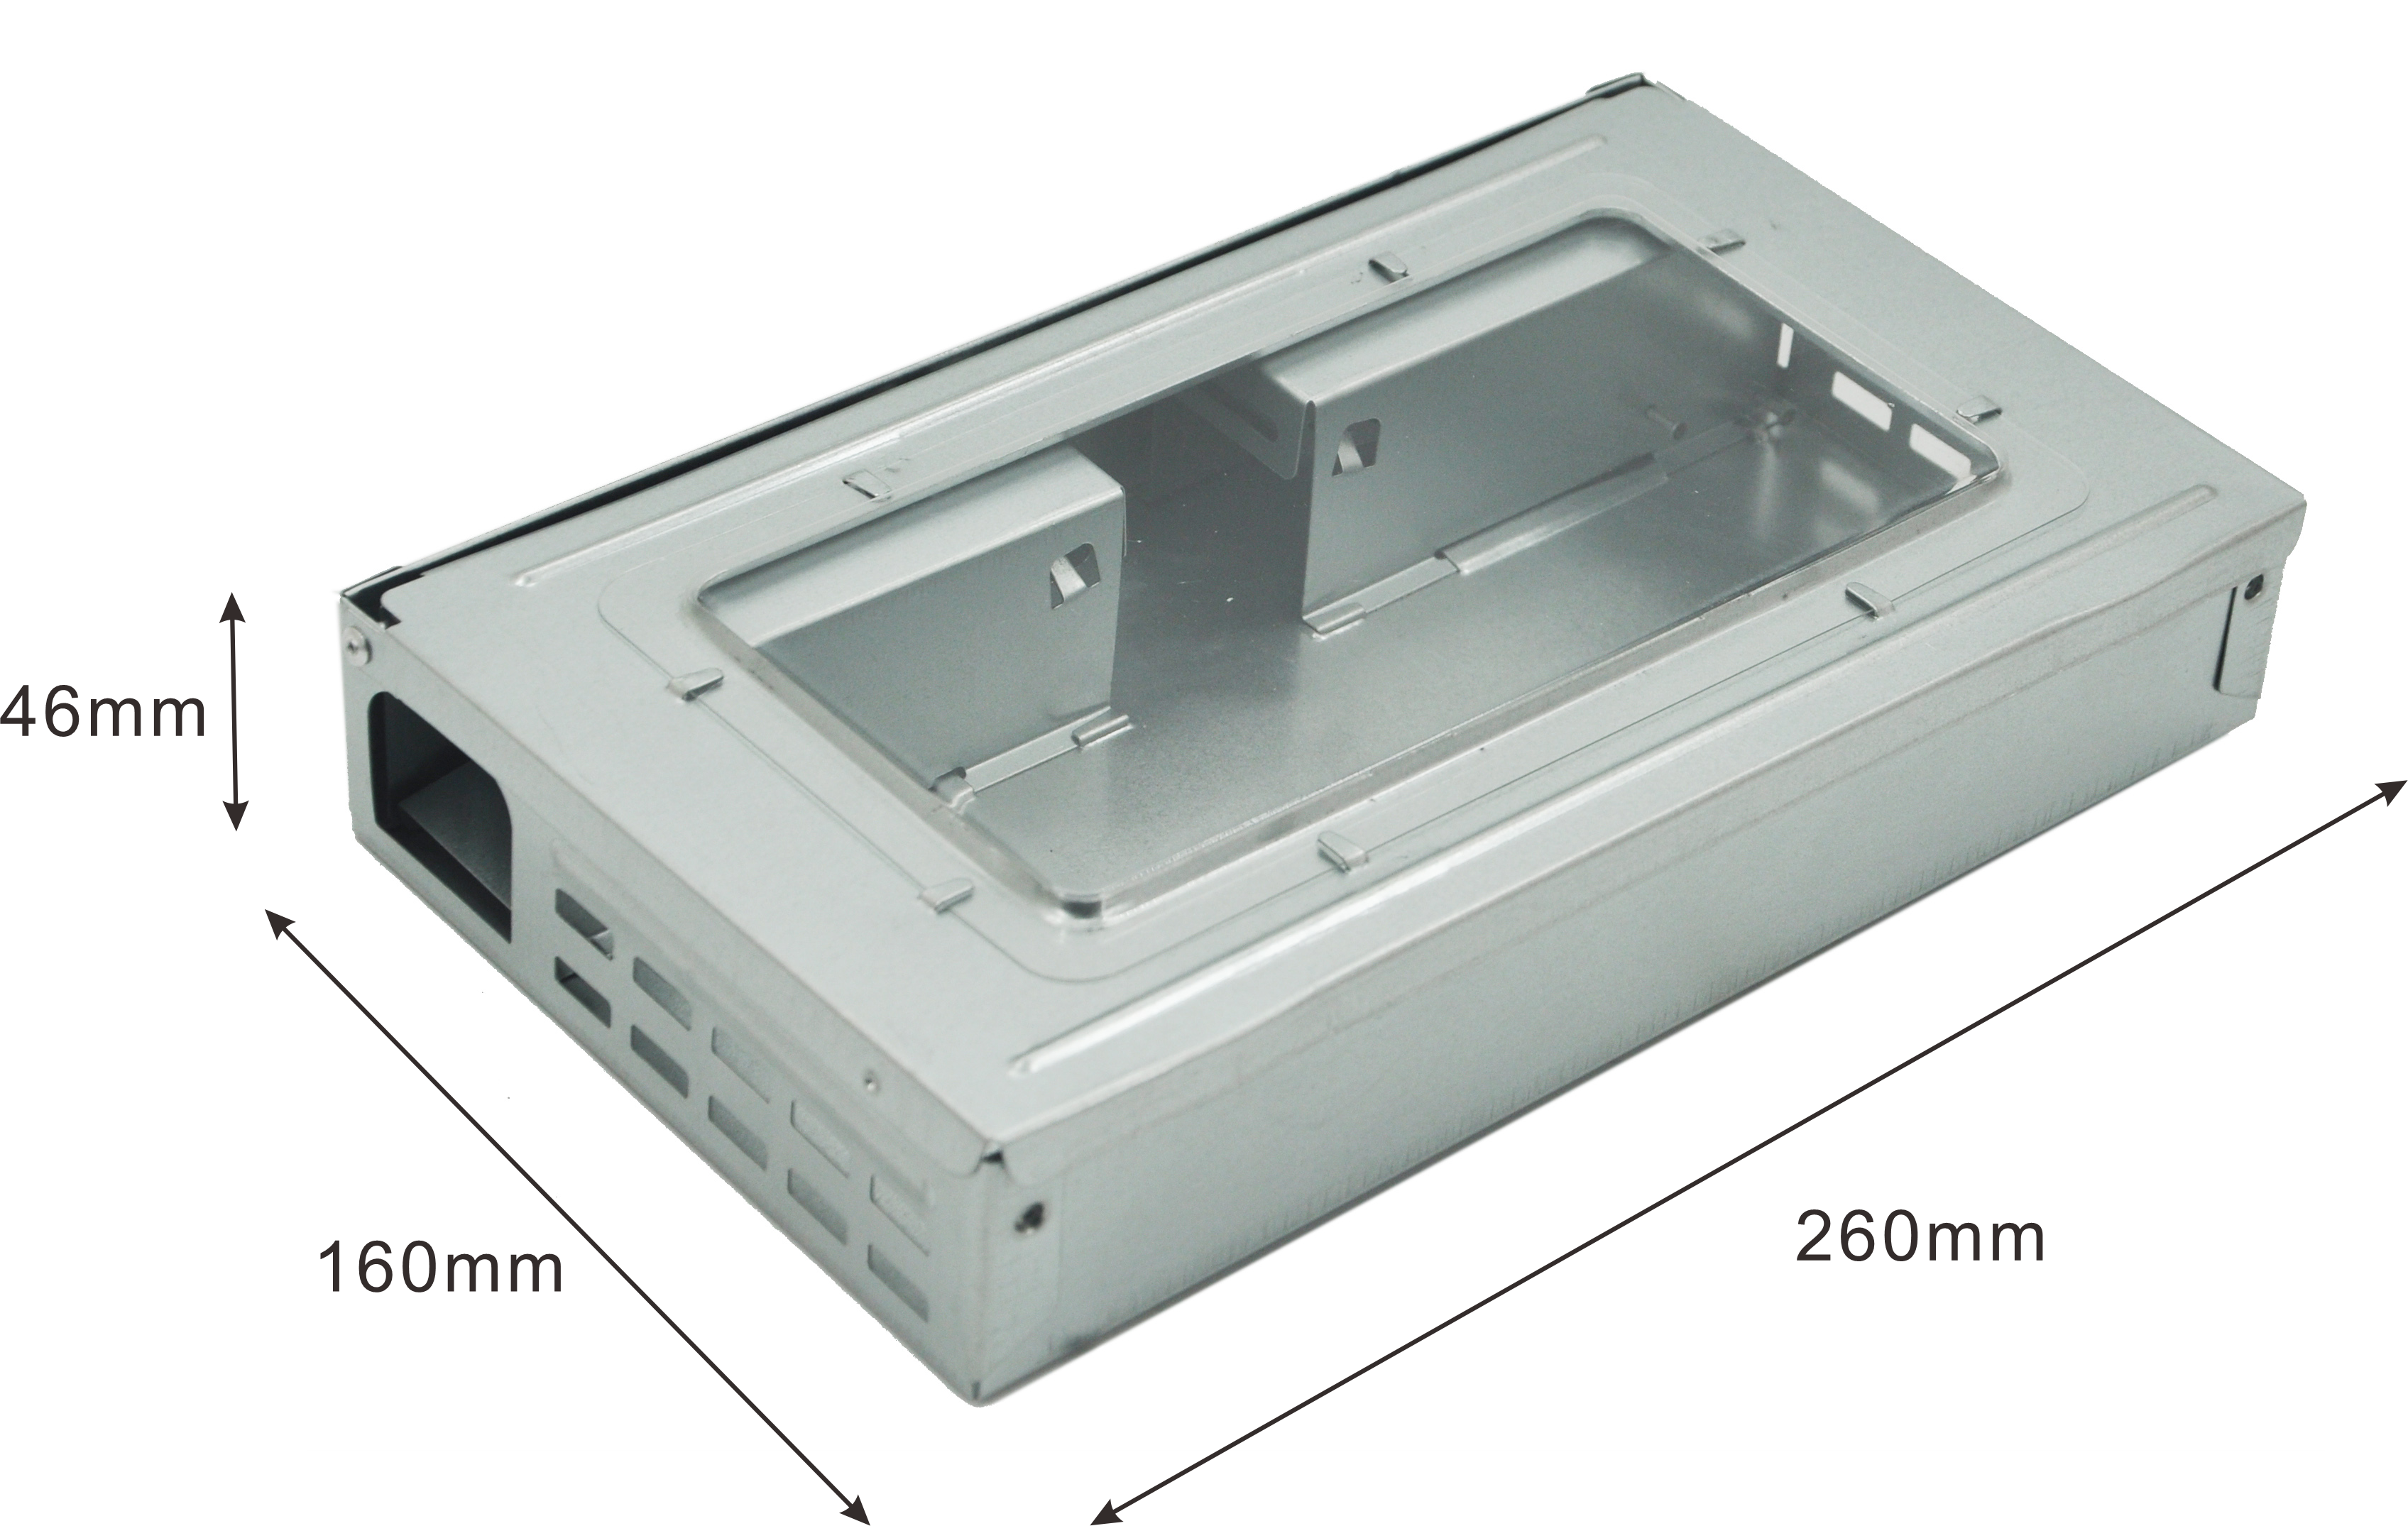
From my workshop in China, I bring you a reliable galvanized steel mouse trap that meets the tough demands of modern pest control. I’m a Manufacturer who understand busy warehouses, farming, and retailers need durable, easy-to-use tools. This galvanized steel mouse trap features corrosion-resistant steel, a strong bite, quick action, and reusable design. It ships assembled, ready to deploy, with safe handling for staff and customers. I offer consistent quality control, competitive prices, and fast lead times to B2B buyers worldwide. Our product minimizes misfires and keeps rodents in check, reducing downtime and damage. If you’re sourcing a dependable tool for high-volume pest control, I’ve got you covered. Contact me for specs, bulk pricing, and customization options. I’m committed to helping your business stay compliant and efficient with every shipment.




galvanized steel mouse trap Where Innovation Meets 2025 Manufacturers You Can Rely On
Galvanized steel mouse traps are entering a new era where durability meets smart design. For global procurement teams, the goal is products that endure harsh environments, resist corrosion, and operate with reliable safety. As innovation aligns with 2025 manufacturing, you can rely on suppliers offering consistent quality, verifiable certifications, and steady regional supply. This is where innovation meets reliable manufacturing in practice. Key criteria include coating quality (zinc thickness and uniform coverage), trap mechanism reliability, and safety features. Also assess packaging, lead times, capacity, pricing, and options for customization. A strong supplier provides clear performance data and scalable production to handle demand surges. To verify credibility, request third‑party tests, QC records, and a transparent warranty. Look for factories with robust quality systems, ethical practices, and responsive after‑sales support. Global buyers should favor partners investing in R&D, standardized processes, and logistics excellence to keep schedules and costs steady.
| Model ID | Trap Type | Size (L × W × H cm) | Gauge (mm) | Material / Finish | Mechanism | Reusable | Environment | Certifications |
|---|---|---|---|---|---|---|---|---|
| M-101 | Standard Snap Trap | 9.0 × 3.2 × 2.5 | 0.63 | Galvanized steel | Spring-loaded | Yes | Indoor | RoHS, REACH |
| M-102 | Heavy-Duty Snap Trap | 11.2 × 3.6 × 2.7 | 0.75 | Galvanized steel | Double spring | Yes | Indoor/Outdoor (sheltered) | RoHS |
| M-103 | Ultra-Compact Snap Trap | 7.8 × 2.9 × 2.1 | 0.50 | Galvanized steel | Single spring | Yes | Indoor | RoHS |
| M-104 | Live-Catch Cage (Galvanized) | 24.0 × 8.0 × 9.0 | 0.90 | Galvanized steel | Cage trap with door | Yes | Indoor/Outdoor | RoHS, REACH |
| M-105 | Pro-Series Double-Action | 12.0 × 4.0 × 3.0 | 0.80 | Galvanized steel | Double spring with shielded trigger | Yes | Indoor | RoHS, REACH |
| M-106 | Industrial Snap Trap | 13.0 × 4.2 × 3.0 | 1.00 | Galvanized steel | Triple spring | Yes | Indoor/Outdoor (covered) | RoHS, REACH |
| M-107 | Multi-Catch Handheld Trap | 14.5 × 5.0 × 3.5 | 0.80 | Galvanized steel | Magnetic-release | Yes | Indoor | RoHS |
Related Products
JL-3001 Humane Multi Catch Mouse Trap – Galvanized Steel Reusable Live Catch Rodent Trap for Professional Pest Control
Read More


galvanized steel mouse trap Supplier Delivers Unmatched Quality
Top Selling Products


- Related Blog
- Reviews
