
Live Cat Catch Trap - China Manufacturer
We are a China based manufacturer and I’m glad to present the Live Cat Catch Trap to B2B buyers who value humane, reliable solutions. Built for easy operation, this trap uses an adjustable trigger and a reinforced steel frame to ensure a clean capture without harm. The durable, weather resistant housing keeps working in rain, dust, or sun, and the smooth release mechanism makes releasing cat safe for handlers and release sites. It is reusable, easy to clean, and ships in compact packaging for fast dispatch in larger orders. I offer flexible sizing and bulk pricing for OEM/ODM needs, so you can brand and scale as you grow. For shelters, pest control services, or property managers, this Live Cat Catch Trap reduces injury risk and improves welfare while cutting long-term costs. If you’re sourcing in China and looking for a reliable manufacturer, we can meet your lead times and quality standards.



Live Cat Catch Trap Service Where Innovation Meets 2025
As global buyers seek humane, compliant trapping solutions, the live-cat capture trap service blends humane trapping science with digital efficiency in 2025. Designed for municipalities, shelters, and facilities prioritizing animal welfare, it covers design, validation, production, and deployment—emphasizing safety, welfare, and regulatory alignment. Its modular approach supports diverse environments and sizes, with configurable kits that scale from urban to rural settings while maintaining humane standards. Key innovations focus on connectivity and data. IoT-enabled traps monitor capture status, door position, tamper alerts, and battery health, sending updates to a secure dashboard and mobile app. Durable, weather-resistant housings and energy-efficient actuation ensure reliability across climates. A quick-release mechanism allows safe relocation, while flexible procurement models, including rental and service plans, ease global deployment and cost control. The result is quality assurance, traceability, and comprehensive support for buyers worldwide.
Live Cat Catch Trap Service Where Innovation Meets 2025
| Region / Area | Site Type | Deployment Window | Trap Type | Avg Setup Time (min) | Real-time Monitoring | Avg Capture Time (min) | Trap Success Rate (%) | Humane Handling Score (0-10) | Daily Traps Deployed | Maintenance Interval (days) | Last Compliance Audit | Wildlife Impact Score (0-100) |
|---|---|---|---|---|---|---|---|---|---|---|---|---|
| North America - Urban Core | Urban | 2024-11 to 2025-01 | Conical Live Trap | 18 | Yes | 16 | 86 | 9 | 120 | 21 | 2025-02-12 | 72 |
| Western Europe - Suburban Belt | Suburban | 2023-05 to 2024-12 | Modular Live Cage | 22 | Yes | 22 | 83 | 9 | 95 | 28 | 2025-01-10 | 70 |
| East Asia - Urban Metro | Urban | 2024-03 to 2025-03 | Smart Sensor Trap | 15 | Yes | 12 | 89 | 9 | 150 | 14 | 2025-03-01 | 66 |
| North Africa - Rural Corridor | Rural | 2023-09 to 2025-02 | Humane Swing Trap | 25 | No | 25 | 78 | 8 | 60 | 21 | 2024-12-18 | 58 |
| Central America - Coastal Region | Rural | 2022-10 to 2024-11 | Carriage Cage | 20 | Yes | 20 | 81 | 8 | 80 | 30 | 2025-02-28 | 60 |
| Sub-Saharan Africa - Urban Center | Urban | 2024-01 to 2025-06 | Portable Live Trap | 17 | Yes | 14 | 84 | 9 | 70 | 14 | 2025-05-02 | 68 |
| Australia - Sydney Suburban | Suburban | 2023-04 to 2025-04 | Hybrid Cage Trap | 14 | Yes | 11 | 92 | 9 | 110 | 21 | 2025-04-15 | 75 |
Related Products
JL 2010 Foldable Galvanized Metal Humane Cat Trap Cage Live Animal Catch Trap for Stray Cats and Small Animals
Read More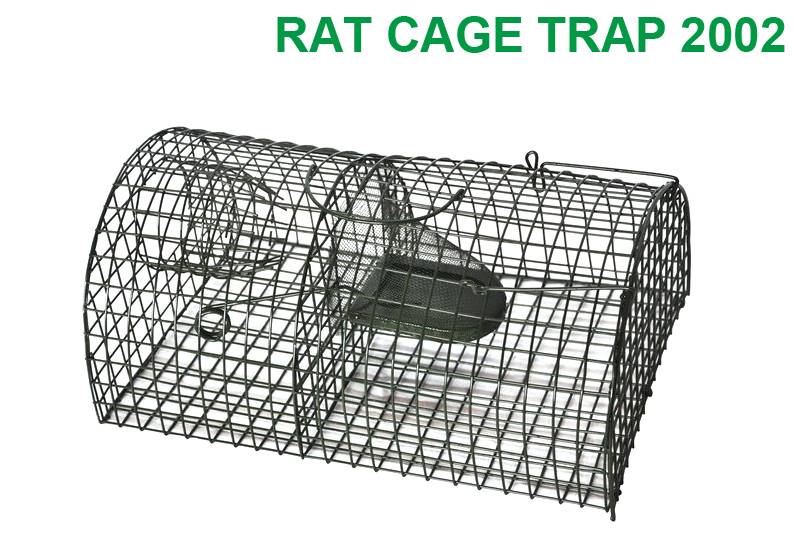




Live Cat Catch Trap Delivers Unmatched Quality Guarantees Peak Performance
Top Selling Products


- Related Blog
- Reviews
