

Wall Mounted Fly Killer | China Manufacturer for Pest Control
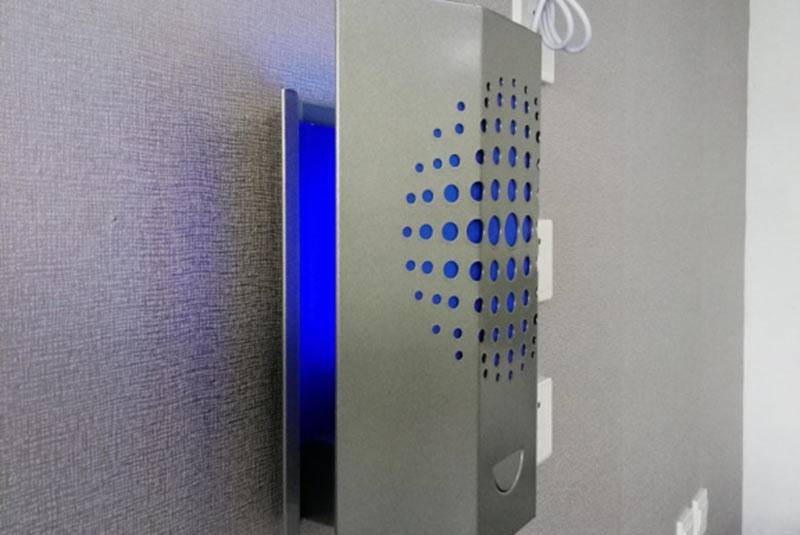
I am a China-based Manufacturer, delivering a wall mounted fly killer that keeps factories, kitchens, and warehouses pest-free. For B2B buyers, this unit stands out with a robust metal housing, easy wall-manging, and energy-efficient UV light that attracts and eliminates flies quickly. Installation is straightforward—two screws and a power supply—no mess, no fuss. The removable tray makes cleaning a breeze, and the sealed grid reduces accidental shocks. Built for heavy duty environments, it resists dust and humidity, yet stays quiet enough for food prep areas. We offer reliable after-sales service and spare parts, with fast shipments to China and worldwide. When you choose a wall mounted fly killer from us, you’re partnering with a trusted Manufacturer who understands industrial needs. Compact, durable, and cost-effective, it fits clean-room or kitchen lines while improving sanitation and compliance.


wall mounted fly killer Ahead of the Curve Now Trending
Wall-mounted fly killers are ahead of the curve, becoming mainstream for global facilities thanks to compact footprints and discreet operation. Modern units combine high‑intensity trapping with sealed housings, delivering fast, hygienic control in kitchens, corridors, and reception areas. Quiet performance, easy cleaning, and resistance to humidity and dust make them suitable for hospitality, logistics hubs, and healthcare environments. For global procurement, value means more than upfront price. Look for energy efficiency, universal voltage options, modular spare parts, and solid warranties. Choose suppliers with scalable models, broad parts availability, and clear testing aligned to international standards. A reliable partner ensures consistent performance, predictable lead times, and cost-effective pest control across multiple sites.
| Model | Power (W) | UV Lamp | Coverage (sq ft) | Dimensions (W x H x D cm) | Weight (kg) | IP Rating | Voltage (V) | Lamp Life (hrs) | Year Introduced | Material | Noise (dB) | Warranty (years) |
|---|---|---|---|---|---|---|---|---|---|---|---|---|
| AX-01 | 6 | UV-A 365 nm, 6W tube | 50 | 26 x 16 x 8 | 1.1 | IPX4 | 110-240 | 8000 | 2018 | ABS+PC | 38 | 2 |
| AX-02 | 9 | UV-A 365 nm, 9W | 75 | 28 x 18 x 9 | 1.3 | IPX4 | 110-240 | 12000 | 2019 | ABS+PC | 40 | 2 |
| AX-03 | 12 | LED UV 395 nm | 100 | 31 x 20 x 9 | 1.8 | IPX5 | 230 | 50000 | 2021 | Aluminum housing | 28 | 3 |
| AX-04 | 15 | UV-A 365 nm, 15W | 120 | 34 x 21 x 11 | 2.1 | IPX5 | 230 | 12000 | 2020 | Stainless steel frame | 32 | 2 |
| AX-05 | 18 | UV-A 365/385 nm, 18W | 150 | 36 x 22 x 12 | 2.4 | IPX4 | 110-240 | 8000 | 2022 | Aluminum + ABS | 35 | 2 |
| AX-06 | 25 | LED UV 395-405 nm | 180 | 46 x 28 x 13 | 3.2 | IPX5 | 230 | 50000 | 2023 | Aluminum housing | 29 | 3 |
Related Products



wall mounted fly killer Market Leader More Than a Supplier - A Partner
Top Selling Products



- Related Blog
- Reviews
