

Wall Mounted Fly Trap - China Manufacturer
As a China-based manufacturer, I understand what B2B buyers need, and this Wall mounted fly trap is built for busy facilities. It hangs neatly on walls in kitchens, warehouses, and factories, saving space while catching flying and fruit flies. The durable, weather-resistant housing and proven attractant system ensure fast, effective control with low maintenance. I ship ready-to-install units with simple mounting brackets and clear instructions, and I offer flexible quantities, short lead times, and competitive pricing for bulk orders. Our trap uses safe, non-toxic attractants, no electricity necessary, and catches insects before they spread. If you’re sourcing from China and need a reliable supplier, I can tailor packaging and branding to meet your market, with OEM/ODM options and after-sales support. Choose this Wall mounted fly trap for steady performance, easy installation, and real pest-control value.


Wall mounted fly trap Industry Leaders Leads the Global Market
Industry leaders in wall-mounted fly traps are driving the global market by combining proven pest-control performance with energy-efficient, hygienic design. Modern units use safe UV attraction or non-toxic adhesive systems to protect foodservice, hospitality, healthcare and industrial facilities while eliminating chemical sprays. Durable materials, low-noise operation, and compact wall-mounted profiles mean easy installation, minimal maintenance and discreet protection across diverse climates and regulatory environments. For global buyers, top manufacturers offer export-ready production, international certifications, flexible OEM/ODM options, reliable logistics and multilingual support so you can scale projects quickly and compliantly. Choosing advanced wall-mounted fly traps reduces operational risk, improves food safety compliance, lowers energy and maintenance costs, and supports sustainable pest management strategies—making them a smart, long-term investment for buyers worldwide.
| Region | Estimated Market Share (%) | 2025–2029 CAGR (%) | Typical Deployment Settings | Predominant Technology | Average Field Efficacy (%) | Common Regulatory Certifications | Estimated Installed Units (2024) | YoY Change (2023→2024) |
|---|---|---|---|---|---|---|---|---|
| Asia-Pacific | 38 | 6.5 | Food processing, hospitality, urban residential complexes | UV LED + adhesive boards (low-ozone) | 88 | CE, RoHS, local food-safety endorsements | 3,200,000 | +12% |
| Europe | 28 | 4.2 | Commercial kitchens, retail, agricultural processing | Electric grid + UV, glue-board hybrids | 85 | CE, RoHS, EN food-safety harmonized marks | 1,800,000 | +6% |
| North America | 20 | 5.0 | Foodservice, grocery stores, institutional facilities | UV fluorescent + adhesive boards (EPA-compliant models) | 86 | UL/ETL listings, EPA guidance adherence | 1,100,000 | +4% |
| Latin America | 8 | 7.0 | Small-to-medium foodservice, marketplaces, residential | UV LED + adhesive boards (cost-optimized) | 80 | Local sanitary approvals, RoHS where applicable | 350,000 | +15% |
| Middle East & Africa | 6 | 5.5 | Hospitality, food distribution centers, urban residential | UV fluorescent with sealed glue trays | 82 | Regional health and safety approvals, RoHS in select markets | 200,000 | +9% |
Related Products


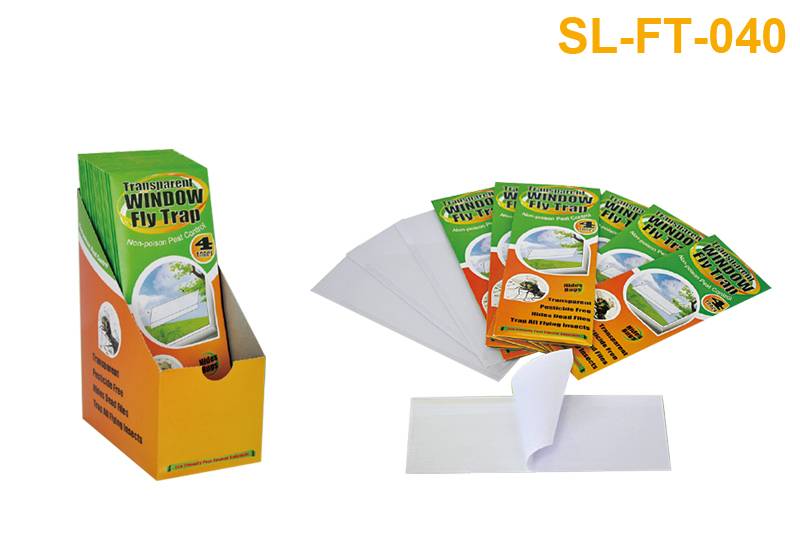

Wall mounted fly trap Manufacturer Delivers Unmatched Quality
Top Selling Products


- Related Blog
- Reviews
