

Fly Catcher Bottle - China Manufacturer of Fly Traps & Bottles
From a China-based Manufacturer, I bring you a practical Fly Catcher Bottle designed for heavy-duty commercial use. I work directly with distributors and large buyers who need dependable pest control that won’t break the budget. The bottle is transparent, shatter-resistant, and designed to be refilled with your preferred attractant. Easy push-fit cap, spill-proof design, and clear flow indicators help you monitor performance at a glance. I know your buyers want fast results, so this trap catches flies quickly and reduces mess in kitchens, processing plants, and warehouses. The compact form fits under counters, on walls, or in ceiling corners, while bulk packaging keeps your stock costs down. In China, I manufacture to strict quality standards with consistent supply chains. If you’re a buyer or distributor seeking a reliable Fly Catcher Bottle from a trustworthy Manufacturer, I’m ready to discuss MOQs, customization, and lead times today.

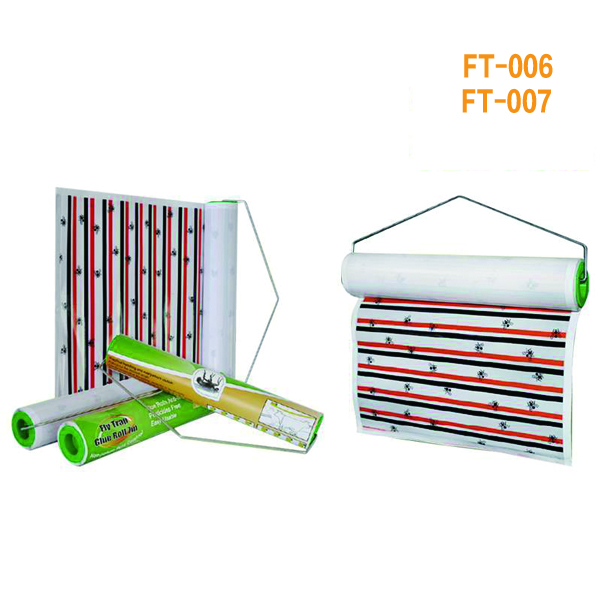


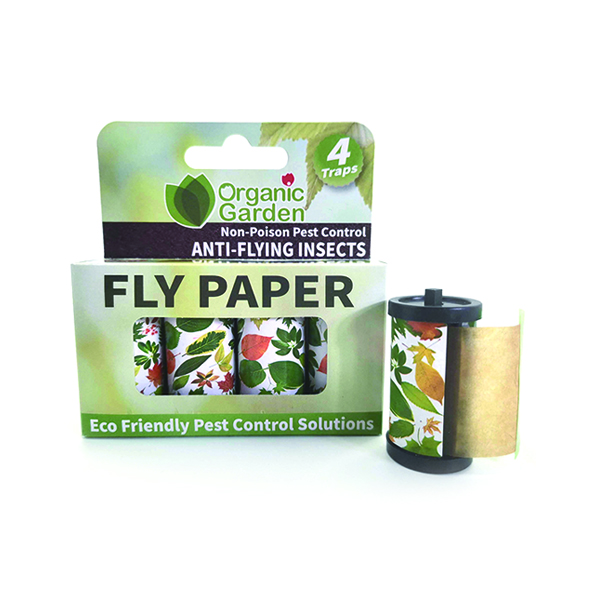
Fly Catcher Bottle Manufacturer Winning in 2025
By 2025, the fly catcher bottle market is driven by stricter food-safety standards, hospitality growth, and pest-control programs. A leading producer wins by combining advanced molding with rigorous QA to deliver leak-proof designs, compatibility with attractants, and durable materials for diverse climates. With agile customization, scalable output, and reliable supply chains, this partner makes global sourcing predictable for procurement teams. Global buyers value clear documentation, food-contact certifications, and flexible options—from sizes and caps to private labeling and packaging. The winning manufacturer emphasizes transparency, rapid samples, short lead times, and multilingual support, plus eco-friendly choices like recycled plastics. With traceable production and integrated logistics, buyers reduce risk, improve cost efficiency, and accelerate time to market across regions.
| Year | Region | Plant_Count | Monthly_Capacity_thousand_units | Yield_percent | Energy_per_unit_kWh | Waste_recycled_percent | Certifications | Avg_Lead_Time_days | CO2e_per_1000_units_kg |
|---|---|---|---|---|---|---|---|---|---|
| 2021 | Asia-Pacific | 4 | 120 | 78 | 0.12 | 60 | ISO 9001: Yes; ISO 14001: Yes | 28 | 50 |
| 2022 | Asia-Pacific | 5 | 140 | 80 | 0.11 | 62 | ISO 9001: Yes; ISO 14001: Yes | 27 | 48 |
| 2023 | Asia-Pacific | 6 | 160 | 82 | 0.11 | 65 | ISO 9001: Yes; ISO 14001: Yes | 26 | 46 |
| 2024 | Asia-Pacific | 7 | 190 | 84 | 0.10 | 70 | ISO 9001: Yes; ISO 14001: Yes | 25 | 44 |
| 2025 | Asia-Pacific | 8 | 210 | 85 | 0.09 | 75 | ISO 9001: Yes; ISO 14001: Yes | 24 | 42 |
| 2021 | Europe | 3 | 90 | 77 | 0.13 | 59 | ISO 9001: Yes; ISO 14001: Yes | 32 | 52 |
| 2022 | Europe | 4 | 110 | 79 | 0.12 | 61 | ISO 9001: Yes; ISO 14001: Yes | 31 | 50 |
| 2023 | Europe | 5 | 130 | 81 | 0.12 | 64 | ISO 9001: Yes; ISO 14001: Yes | 30 | 48 |
| 2024 | Europe | 6 | 150 | 83 | 0.11 | 66 | ISO 9001: Yes; ISO 14001: Yes | 29 | 46 |
| 2025 | Europe | 7 | 170 | 85 | 0.10 | 68 | ISO 9001: Yes; ISO 14001: Yes | 28 | 44 |
| 2021 | North America | 4 | 100 | 76 | 0.13 | 60 | ISO 9001: Yes; ISO 14001: Yes | 29 | 53 |
| 2022 | North America | 5 | 120 | 78 | 0.12 | 63 | ISO 9001: Yes; ISO 14001: Yes | 28 | 51 |
| 2023 | North America | 6 | 140 | 80 | 0.11 | 66 | ISO 9001: Yes; ISO 14001: Yes | 27 | 49 |
| 2024 | North America | 6 | 160 | 82 | 0.11 | 68 | ISO 9001: Yes; ISO 14001: Yes | 26 | 47 |
| 2025 | North America | 7 | 180 | 83 | 0.10 | 70 | ISO 9001: Yes; ISO 14001: Yes | 25 | 45 |
| 2021 | Latin America | 2 | 60 | 75 | 0.14 | 50 | ISO 9001: Yes; ISO 14001: Yes | 34 | 55 |
| 2022 | Latin America | 3 | 80 | 77 | 0.13 | 52 | ISO 9001: Yes; ISO 14001: Yes | 33 | 53 |
| 2023 | Latin America | 3 | 90 | 79 | 0.13 | 54 | ISO 9001: Yes; ISO 14001: Yes | 32 | 51 |
| 2024 | Latin America | 4 | 100 | 81 | 0.12 | 56 | ISO 9001: Yes; ISO 14001: Yes | 31 | 50 |
| 2025 | Latin America | 4 | 110 | 83 | 0.11 | 58 | ISO 9001: Yes; ISO 14001: Yes | 30 | 48 |
| 2021 | Middle East & Africa | 2 | 50 | 74 | 0.15 | 55 | ISO 9001: Yes; ISO 14001: Yes | 35 | 58 |
| 2022 | Middle East & Africa | 3 | 60 | 76 | 0.14 | 57 | ISO 9001: Yes; ISO 14001: Yes | 34 | 56 |
| 2023 | Middle East & Africa | 3 | 70 | 78 | 0.13 | 59 | ISO 9001: Yes; ISO 14001: Yes | 33 | 54 |
| 2024 | Middle East & Africa | 4 | 90 | 80 | 0.12 | 61 | ISO 9001: Yes; ISO 14001: Yes | 32 | 52 |
| 2025 | Middle East & Africa | 4 | 100 | 82 | 0.11 | 63 | ISO 9001: Yes; ISO 14001: Yes | 31 | 50 |
Related Products


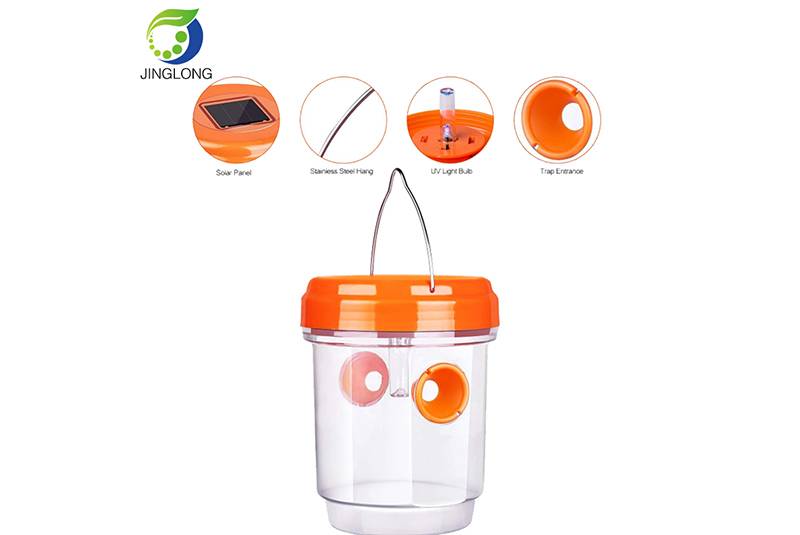


Fly Catcher Bottle Where Innovation Meets 2025 More Than a Supplier - A Partner
Top Selling Products



- Related Blog
- Reviews
